We know there are more craft breweries canning today than ever. We see all of the press releases announcing so, and we see the extra shelf space devoted to them in our favorite spots to buy craft beer. But all of that is anecdotal. How big is this shift really?
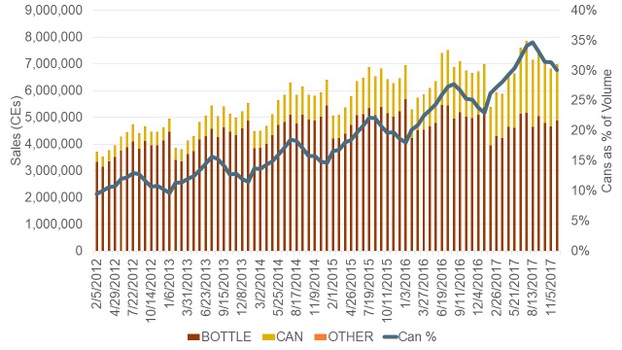
When you want some real answers, we recommend turning to Bart Watson, chief economist of the Brewers Association. He crunched the numbers in a new blog post on the BA’s website, and he found that bottles still dominate, but the bottle share of the market is for sure decreasing:
Based on the 2016 Brewery Operations and Benchmarking Survey, I estimate that craft brewer production volumes are roughly 41.4% draught (either kegged or via brite tank) versus 58.6% packaged. Cans rose to 16.7% of total craft production, against 41.9% for bottles, meaning that cans are 28.5% of packaged production. Scan was a bit less bullish on cans, and had the percentage at 24.5% of scan packaging in 2016. Keep in mind that scan over-indexes on regional craft brewers, who tend to have a higher percentage of bottles in their packaging mix, so the actual percentage may have been closer to the surveyed figure. With another year of growth, the 2017 scan figures are actually a bit higher than the benchmarking results, with cans representing 30.9% of packaged volume in 2017 (through 12.24.17). If we use the same draught/packaged breakdown from benchmarking, that would make cans ~18 share of overall craft production.
In scan, we can attribute the growth in cans primarily to two things: shifting mix within breweries and patterns of growth, where breweries that have higher can share are growing faster than those with lower share. This is almost entirely a size effect, where smaller brewers tend to be growing faster.
Watson has even more to say about and what it means going forward. Read the full insight here.

Leave a Reply
You must be logged in to post a comment.