
In 2024, it seems I can’t escape conversations on how taprooms can attract new audiences. No longer can a brewery survive off the consumption habits of your stereotypical beer nerd, but rather, they must now appeal to greater demographics, with changing preferences. So, why should your brewery go forth on a quest to get new and different butts in seats? Money.
Well, money, and your desire to not only create more profitable experiences, but also give new audiences a reason to return.
Let’s peek at how much different age ranges spend in breweries.
The data was collected from a set of 2239 unique taproom visits from January 1, 2021 to November 14, 2022. Each visit represents an average of 2 guests and the total spend includes tip. The average visit in our data set generated $51.33 with a tip of 25.5%.
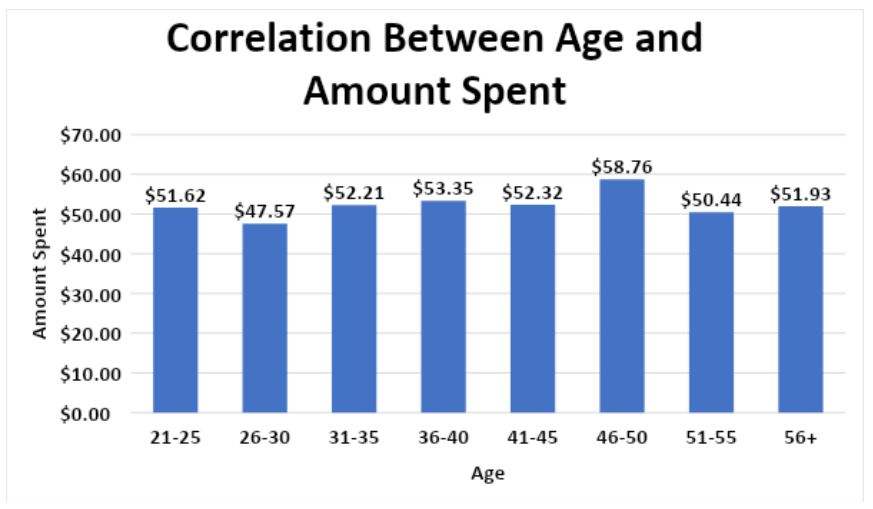
TLDR: Gen Xers 46-50 years old spend the most per tab at $58.76. Gen Zers tip the highest at 27.5%. Parties of Gen Zers spend the most per taproom visit.
Looking at how much guests across different age ranges spend, it’s all over the place. One on hand, this is good, as your staff should never anticipate a guest being a better, or worse, spender because of their age. However, this does not lead to any strong conclusions. We do see a general positive trend showing that as age increases, average spend also does – peaking with 46–50-year-olds spending $58.76 per visit. Those 26-30 years old spend the least per visit, at $47.57.
Only the 26-30- and 51–55-year-olds fall below the average spend from our data set.
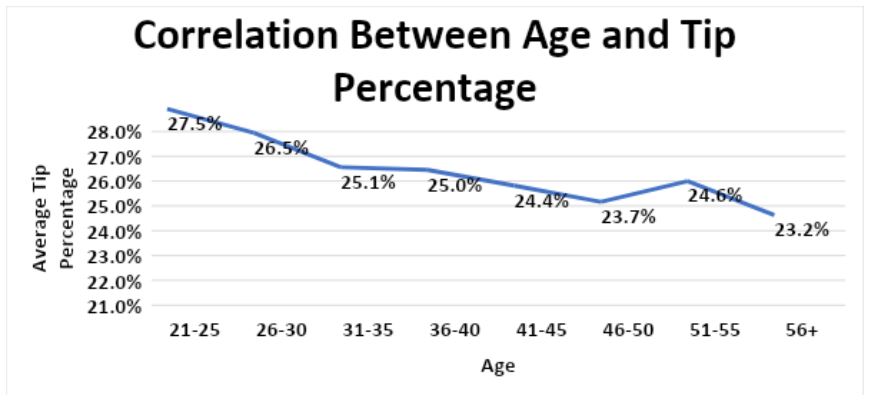
How does age impact tipping habits? Going into this, I had read quite a few articles on the younger generations tipping less and had anticipated to find the same within our data. Looking at the average tip percentage with age, the data shows the older a person gets, the less they tip. I did not expect this inverse relationship.
However, there are several arguments for this:
- People are more likely to tip people like themselves, and the average age of taproom workers skews younger. While we could not find taproom specific figures, the hospitality industry employs a much larger proportion of younger workers than the overall economy. The average age of those working in “drinking places, alcoholic beverage,” per the U.S. Bureau of Labor Statistics is 35.2 years old. 25-34-year-olds, at 32.5%, represent the largest segment of these workers.
- Those who have worked for tips themselves are usually more likely to leave one. Younger adults and those in-lower-income households are all, according to the Pew Research Center, more likely than others to have worked in this type of job.
- CreditCards.com has also found younger generations tend to leave slightly higher tips. With brewery visits becoming more intentional, younger people may be visiting less, but tipping more when they do.
[Breweries have a love, often hate, relationship with food trucks, and humorously, those surveyed by Forbes Advisor in 2023 ranked food trucks at the top of services which they believe shouldn’t ask for a tip.]
Looking at a Pew article on Tipping Culture in America: Public Sees a Changed Landscape, from November 2023, an interesting takeaway is that those with a lower income are more confident of when to tip. 77% of those with a lower income state that it’s “extremely/very easy” or “somewhat easy” to know when to tip. Only 62% of those with an upper income fall under these criteria. Those with less education are also more likely to know when to tip vs those with higher levels of income.
Also from this article, there is an inverse relationship with those who favor businesses suggesting how much to tip with age. Those 18-29-year-olds are 72% more likely to favor businesses giving customers suggestions about how much to tip.
Pew data, like our set, also shows that older people are slightly more likely than younger adults to tip less.
Engagement and tipping
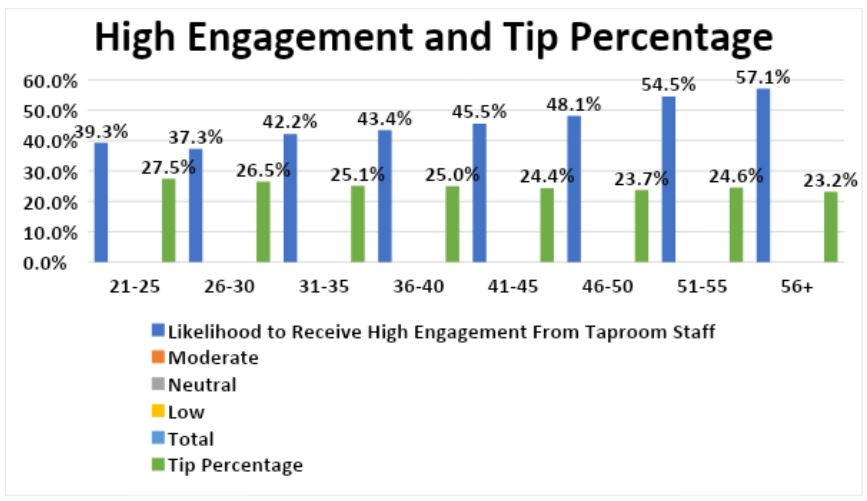
One reason that does not explain why younger people are tipping a higher percentage is the fact that they are less likely to receive a high level of engagement from taproom staff. Guests 21-25 are 45.3% less likely to receive a high level of engagement from taproom staff than guests 56+. We define high engagement as when the staff goes above and beyond standard acts of service (i.e. greeting guests, offering recommendations), and “wow’s” the guest.
This is a bit unexpected as younger 21-25 and 26-30 tip a higher average percentage than older taproom guests.
A study conducted by OnePoll in 2023 shows that 3 out of 10 Americans suffer from “menu anxiety” when ordering from a restaurant. This is higher among young generations, with Gen Z and Millennials 41% likely to experience this, vs 15% of those 44+. Perhaps for this younger generation, less is more. While I preach engaging at a high level, the type of engagement offered to Gen Zers and Millennials, needs to be customized for their unique needs. Taproom staff still have the ability to build meaningful relationships with younger guests; however, an approach of shorter, but equally as informative/personable interactions, may result in the most positive visits. And because they appreciate and respect the approach you’ve taken, they tip higher.
Each taproom guest has unique goals and expectations when visiting. It is your team’s job to best understand what they’re looking for and craft the ideal experience for them.
How party size plays into it
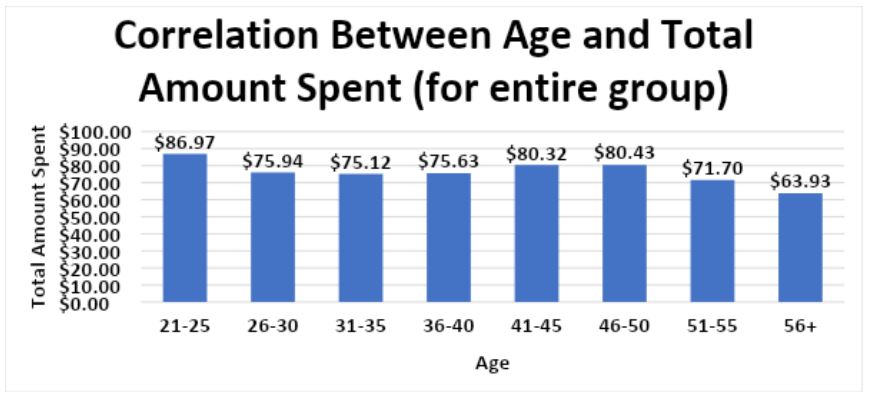
We’ve learned that the average tab for guests 46-50 is the highest; however, looking at all guests in their party, is this the most valuable group you get in your taproom? The answer is “no.” Despite representing the average highest tab, those 46-50 come in the average group of 2.73 guests. The average group of 21–25-year-olds visits as a party of 3.01. This party has a total value of $86.97, $6.54 more or 8.1% higher than a party of 46–50-year-olds.
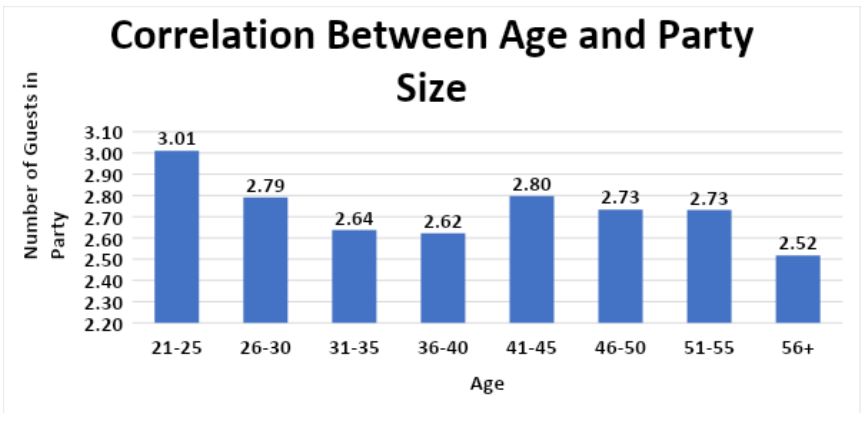
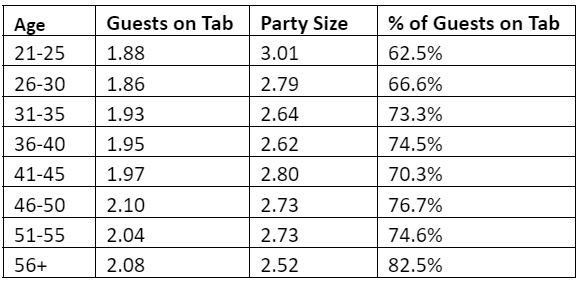
We’re getting heavy in data and terminology, and I want to define several terms we’ll be using. Guests on tab represents the average number of people on one check. Party size represents the total number of guests in a group. For example, it may be my wife and I on one check, but if we were also joined by a friend, the party size would be 3. We use percentage of guests on one tab to represent the formula (Guests on Tab)/(Party Size).
Those 21-25 and 26-30 years old have tabs with the least number of guests on them, 1.88 and 1.86 respectively. Guests 46-50 see the highest number of people per tab, at 2.1. When looking at the relationship between the number of guests on a tab and the total party size. Groups of 21-25-year-olds see an average of 62.5% of guests on the same tab (1.88 out of 3.01 guests). Guests 56+ see the highest percentage of guests per tab at 82.5%, 2.08 out of 2.25 guests.
With this knowledge, should your staff cater differently to taproom guests based on age or party size? Outside of perhaps different engagement styles when interacting with parties of different sizes, your taproom staff should seek to provide the highest quality experience for everyone that visits your brewery. Just like you should help each guest find the right beverage, it is your responsibility to cater your experience to their needs and provide a high level of hospitality.
What not to do:
- Do not give preferential treatment to specific guests. Sure, it’s okay to recognize regulars/mug club members for their loyalty, but don’t let this take away from another guest’s experience.
- Do not pigeonhole your taproom as a place only welcome to specific types of people.
- Do not frown upon guests unfamiliar with beer, breweries, and the taproom experience.
- Do not stereotype.
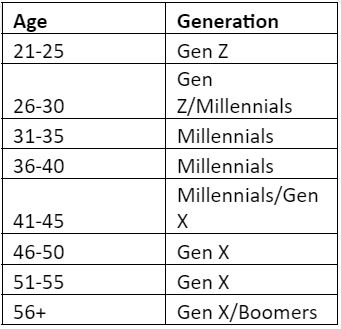
- Do not make assumptions based on the above data. Just because the average Boomer only tips 23.2% doesn’t mean they deserve any less engagement than the average Gen Zer tipping 27.5%.
What to do:
- Treat each guest as if they could become your next best regular.
- Facilitate a space and staff that can build meaningful relationships with all guests.
- Train staff to use context clues to craft the right level of engagement to all visitors.
- Offer multiple types of menus to provide each guest the optimal ordering experience.
- Create unique experiences for all. Guests are no longer visiting just for beer. Other factors are driving taproom visits.
- Be teachers. Whether the Gen Zer on their first taproom visit or the Gen Xer visiting their 1000th, share your unique story and educate them on your beers and beverages.
- Ask. If you don’t know, ask. Ask questions to understand your guests’ needs and to build human connections.
Why Millennials (and Gen Zers) matter
Millennials became the largest generation group in the United States in 2022. They’ve got money to spend and you possess the opportunity to teach them and welcome them into the world of taprooms.
Why all guests matter
It’s all about survival. The more guests you can serve in your taproom, the more you’re likely to make it another year. Invest in staff training, invest in your guests, and invest in creating memorable experiences for everyone who may step foot in your taproom.
The data was collected from a set of 2239 unique taproom visits from January 1, 2021 to November 14, 2022. Each visit represents an average of 2 guests and the total spend includes tip.
The data set includes unique taprooms visits from 382 21-25-year-olds, 582 26-30-year-olds, 408 31-35-year-olds, 251 36-40-year-olds, 178 41-45-year-olds, 135 46-50-year-olds, 134 51-55-year-olds, and 170 above the age of 56.
Andrew Coplon is the Founder of Secret Hopper, a mystery shopping company for craft beer businesses, and Craft Beer Professionals, a community dedicated to the growth and betterment of the craft beer industry. Check out all of his CBB articles here.


Leave a Reply
You must be logged in to post a comment.