Before I get started with part 2, I want to note that part 1 received a lot of attention from the brewing community. This topic is much more important than I imagined. Let’s recap the first article: Breweries under 50,000 bbls in annualized production may encounter difficulties in calculating COGS using an Activity Based Costing method. The reason? The data history and processes are not there to support the calculation.
So, what do we use, for management, to track cost and guide growth?
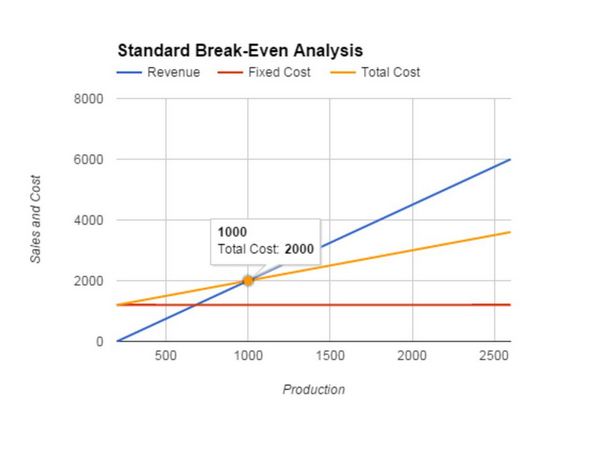
We have found that a modified breakeven analysis that assigns direct labor and overhead as fixed cost, rather than variable cost, is an effective way to analyze it. The typical breakeven analysis (fig. below) of direct materials, labor and overhead would increase at a constant rate with production and be included in total cost.

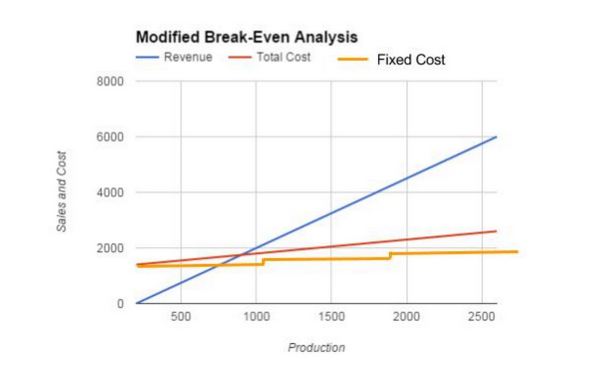
Our modified break even treats labor and overhead as they actually act in a brewery with incremental increases over time (fig. below). Note in this graph, fixed costs “step up” as production increases. You will also note that total cost does not ramp up as aggressively as it would in a standard break-even. Example: A startup brewery could easily grow to 1,000 bbls in production just by adding one additional employee. We have seen this to be the case, which is why we are comfortable assigning these modifications to fixed costs.

Analysis
Enough with the fluff. Our modified break-even analysis starts with creating departments. Typically, we use wholesale and retail to start since most breweries have both. We are looking at beer production and beer sales only, leaving out any ancillary services/products the brewery may offer. From there we have developed an internal profit and loss statement to help us calculate the break-even point. This internal profit and loss mirrors the modified break-even by allocating direct labor and direct overhead as fixed cost.
Our first run at this gathers the actual data from the brewery. Below is an example:
| Small Batch Standard Brewing | |||
| Profit and Loss (internal) | |||
| thru Jan 2016 | |||
| Revenue | Wholesale | Taproom | |
| Units Sold (BBL) | 100 | 17 | |
| Average Price Per Unit | $255.72 | $1,185.96 | |
| Total Revenue | $25,571.87 | $20,161.32 | |
| Cost of Goods Sold | |||
| Units Produced (BBL) | 100 | 17 | |
| Goods manufactured (DM) | $58.82 | $58.81 | |
| Cost of Goods Sold | $5,881.53 | $999.77 | |
| Gross Profit (Loss) | $19,690.34 | $19,161.55 | |
| Semi/Fixed Brewery | |||
| Production Wages | $20,000.00 | ||
| Utilities | $7,080.00 | $1,200.00 | |
| Rent | $14,009.00 | $1,400.90 | |
| Brewery Expense /Misc/Taproom | $19,886.00 | $2,300.00 | |
| Total Semi Fixed Brewery operations | $60,975.00 | $4,900.90 | |
| Semi/Fixed VSGA | |||
| Advertising | |||
| Excise taxes | $700.00 | $119.00 | |
| Total Semi Fixed VSGA. | $700.00 | $119.00 | |
| Fixed Expenses SGA | |||
| Guaranteed Payment | $4,500.00 | ||
| Admin | $7,000.00 | $3,500.00 | |
| Taproom Staff | $2,500.00 | ||
| Martketing | $3,000.00 | $12,000.00 | |
| Interest | $3,500.00 | $350.00 | |
| Other Taxes | $70.00 | ||
| Total Fixed Expenses SGA | $18,070.00 | $18,350.00 | |
| Total all fixed costs | $85,626.53 | $23,369.90 | |
| Summary | |||
| Total Revenue | $25,571.87 | $20,161.32 | |
| Total Expenses | $85,626.53 | $24,369.67 | |
| Net Income | (60,054.66) | (4,208.35) | |
In our example brewery, we are using bbls as the unit of measure. You will notice that the wholesale department, selling 100 bbls per month, is operating at a ($60,054.66) loss. The taproom selling 17 bbls per month is operating at a ($4,208.35) loss. Next, we begin playing with the model to see what it will take to break even.
The following are the results to get the wholesale operations to breakeven. The brewery must sell 435 bbls per month to breakeven given its current costs.
| Small Batch Standard Brewing | |||
| Income Statement (internal) | |||
| thru Jan 2016 | |||
| Revenue | WHOLESALE | Current | Breakeven |
| Units Sold | 100 | 435 | |
| Average Price Per Unit | $255.72 | $255.72 | |
| Total Revenue | $25,571.87 | $111,164.75 | |
| Cost of Goods Sold | |||
| Units Produced (BBL) | 100 | 435 | |
| Goods manufactured (DM) | $58.82 | $58.82 | |
| Cost of Goods Sold | $5,881.53 | $25,567.89 | |
| Gross Profit (Loss) | $19,690.34 | $85,596.86 | |
| Semi/Fixed Brewery | |||
| Production Wages | $20,000.00 | $20,000.00 | |
| Utilities | $7,080.00 | $7,080.00 | |
| Rent | $14,009.00 | $14,009.00 | |
| Brewery Expense /Misc | $19,886.00 | $19,886.00 | |
| Total Semi Fixed Brewery operations | $60,975.00 | $60,975.00 | |
| Semi/Fixed VSGA | |||
| Advertising | |||
| Excise taxes | $700.00 | $3,043.01 | |
| Total Semi Fixed VSGA. | $700.00 | $3,043.01 | |
| Fixed Expenses SGA | |||
| Guaranteed Payment | $4,500.00 | $4,500.00 | |
| Admin | $7,000.00 | $7,000.00 | |
| Martketing | $3,000.00 | $6,509.00 | |
| Interest | $3,500.00 | $3,500.00 | |
| Other Taxes | $70.00 | $70.00 | |
| Total Fixed Expenses SGA | $18,070.00 | $21,579.00 | |
| Total all Costs | $85,626.53 | $111,164.90 | |
| Summary | |||
| Total Revenue | $25,571.87 | $111,164.75 | |
| Total Expenses | $85,626.53 | $111,164.90 | |
| Net Income | (60,054.66) | $0.00 | |
The jump from 100 to 435 bbls per month will be interpreted differently by each brewery. You should know, based on your capacity and packaging mix if 1) this is possible and 2) if you will we need to hire more people to achieve the goal.
The following are the results to get the retail operations to break-even. The brewery must sell 20 bbls per month to break-even given their current costs.
| Small Batch Standard Brewing | |||
| Income Statement (internal) | |||
| thru Jan 2016 | |||
| Revenue | RETAIL | Current | Breakeven |
| Units Sold | 17 | 20 | |
| Average Price Per Unit | $1,185.96 | $1,185.96 | |
| Total Revenue | $20,161.32 | 23,719.20 | |
| Cost of Goods Sold | |||
| Units Produced (BBL) | 17 | 20 | |
| Goods manufactured (DM) | $ 58.81 | $ 58.81 | |
| Cost of Goods Sold | $999.77 | 1,176.20 | |
| Gross Profit (Loss) | $19,161.55 | $22,543.00 | |
| Semi/Fixed Brewery | |||
| Production Wages | |||
| Utilities | $1,200.00 | $1,200.00 | |
| Rent | $1,400.90 | $1,401.00 | |
| Brewery Expense /Misc | $2,300.00 | $2,300.00 | |
| Total Semi Fixed Brewery operations | $4,900.90 | $4,901.00 | |
| Semi/Fixed VSGA | |||
| Advertising | |||
| Excise taxes | $119.00 | $140.00 | |
| Total Semi Fixed VSGA. | $119.00 | $140.00 | |
| Fixed Expenses SGA | |||
| Guaranteed Payment | |||
| Admin | $3,500.00 | $3,500.00 | |
| Taproom | $2,500.00 | $2,500.00 | |
| Martketing | $12,000.00 | $12,000.00 | |
| Interest | $350.00 | $350.00 | |
| Other Taxes | |||
| Total Fixed Expenses SGA | $18,350.00 | $18,350.00 | |
| Total Fixed Costs | 23,369.90 | 23,391.00 | |
| Summary | |||
| Total Revenue | 20,161.32 | 23,719.20 | |
| Total Expenses | 24,369.67 | 23,391.00 | |
| Net Income | (4,208.35) | 328.20 | |
The jump from 17 to 20 bbls per month in the tasting room should be attainable. Tasting rooms are unique given their high profit margins. In my experience, a typical tasting room should be able to breakeven within 60 days of opening.
Data Collection
In order to build these templates, we collect heavy data the first time we do it. We analyze and stress the data to make sure that what we are using is meaningful. The process becomes easier and easier once you have a template built. We rely on the brewery management software to capture the revenue for wholesale and cost of direct materials. We rely on the point-of-sales for a breakdown of the retail revenue. The remaining info can be pulled from the accounting software if the chart of accounts is set up properly. Of course, with any analysis the data must be current to be relevant. This is one of the biggest issues with financial accounting — its lagging information. This template is managerial accounting and could be updated shortly after month end to plan for the future.
Application
I have given you our solution to replace an Activity Based Costing analysis to determine COGS. Once set up, the results are easily understood by management and brewers. Think about it: What good is a report if people do not understand it? What good is a report if it cannot direct change when change is needed? The department approach gives the owners a quick peek at what is working and what is not.
Example: If wholesale is at max capacity and losing money each month, we focus on labor and materials as the fix. Another example: If wholesale begins outperforming retail for the first time in the history of the brewery, this need an explanation. The possibilities are endless.
The following are suggested benchmarks we have used with our customers.
Startup — Get to break-even. Period
0 — 10,000 bbls — The analysis is run quarterly. We ensure break-even occurs. We model out for expansion by looking at the “what happens” when XX bbls are produced. This gives the team some assurance that the growth is substantiated.
10,001 — 25,000 bbls — The analysis is run monthly. We look at different units of measurement other than bbls. Grouping everything into bbls is the path of least resistance when you are small. Graduation from this metric occurs during this period. We analyze core brands. We take a closer look at labor to determine if our theory of a fixed cost remains true.
25,000 and up — Analysis can be run as frequent as needed up to real time dash boarding. We introduce standard costs for direct labor and overhead to begin moving to an Activity Based Costing model. The modeling opportunities at this level are endless.
I hope this has brought some clarity on how to determine your COGS. I know it works well for our customers. I encourage you to sign up for our Crafting Candor Community where I share more on this topic and others that can be beneficial to brewery growth.
Chris Farmand is the founder of Small Batch Standard, a CPA firm serving breweries and distilleries across North America. Farmand has 15 years of tax and accounting experience with the last five dedicated to the brewing industry. Small Batch Standard is the leading financial, tax, and growth consulting option for the “head of the class” breweries. Compliance is our baseline, growth is our focus. Chris can be reached at [email protected].


RT @CraftBrewingBiz: Here’s our cost accounting hack for craft breweries under 50,000 bbls, part 2. https://t.co/pgoFtGVazB https://t.co/Un…
Juan Carlos Sibaja Delcore liked this on Facebook.
RT @ekosbrewmaster: Great info from @cfarmand: Cost accounting hack for craft breweries under 50,000 bbls, part 2 #CraftBeer #BeerBiz https…
Great info from @cfarmand: Cost accounting hack for craft breweries under 50,000 bbls, part 2 #CraftBeer #BeerBiz https://t.co/mDkkpDyLWk
Alex Novicki liked this on Facebook.
Steve Dornblaser liked this on Facebook.
Jerry Elliott liked this on Facebook.
Serge Lubomudrov liked this on Facebook.
Paul Speed liked this on Facebook.
Cost accounting hack for craft breweries under 50,000 bbls, part 2 https://t.co/TVVnh0voRc via @craftbrewingbiz
RT @cfarmand: Here it is Cost accounting hack for craft breweries under 50,000 bbls, part 2 https://t.co/nzyRVlqN8D
John Paul liked this on Facebook.
Here it is Cost accounting hack for craft breweries under 50,000 bbls, part 2 https://t.co/nzyRVlqN8D
#CraftBeer #CraftBrewing #Beer #BeerBiz Cost accounting hack for craft breweries under 50,000 bbls, part 2 https://t.co/UuJP0dBGnO