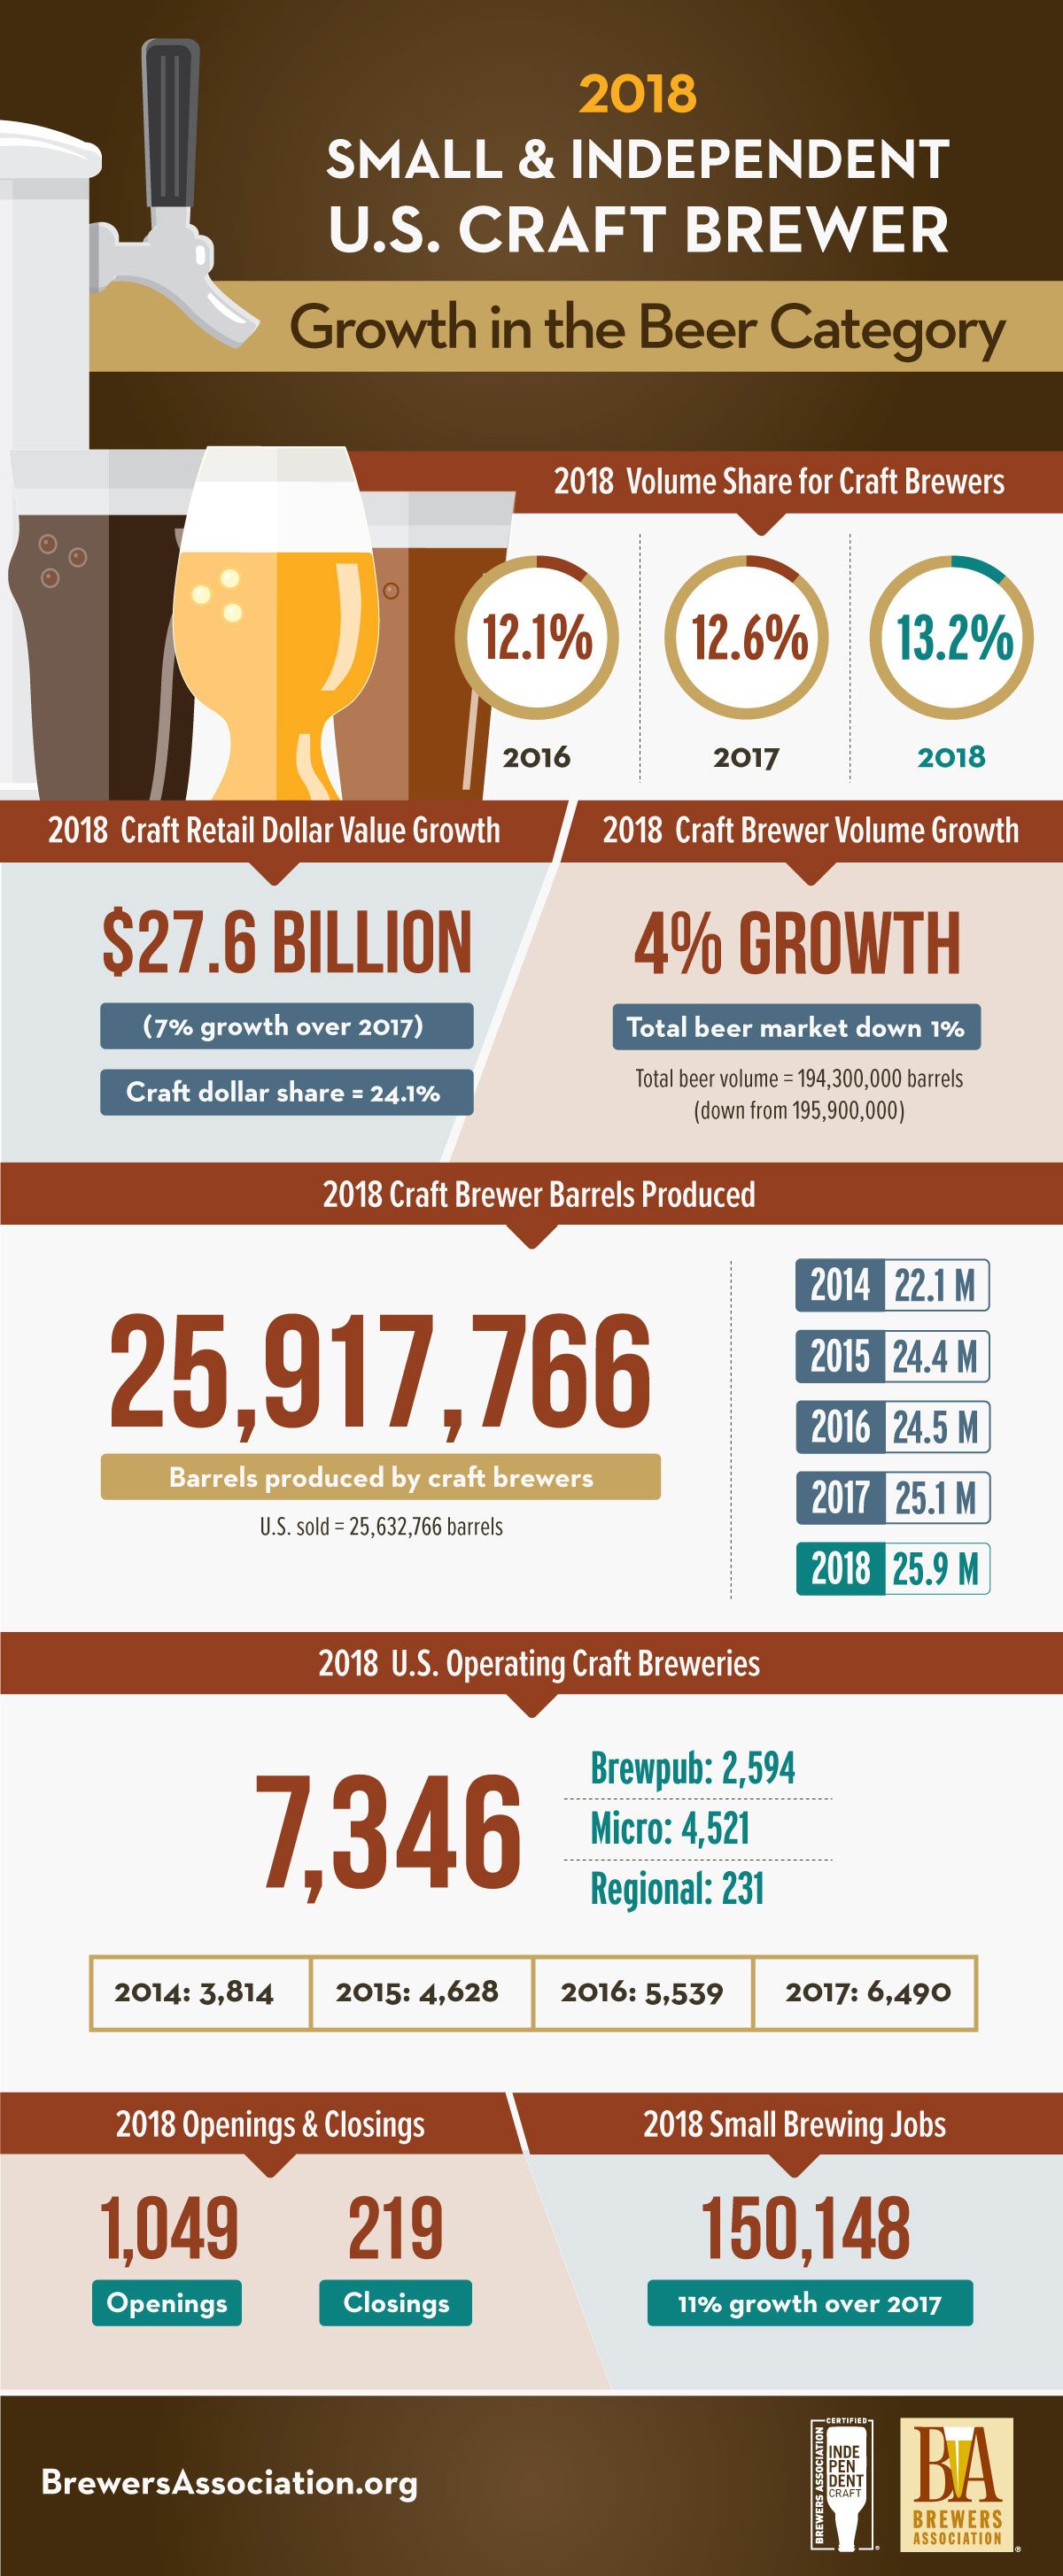
The Brewers Association (BA) — the trade association representing small and independent American craft brewers by its definition— just released annual growth figures for the U.S. craft brewing industry yesterday*. In 2018, small and independent brewers collectively produced 25.9 million barrels and realized 4 percent total growth**, increasing craft’s overall beer market share by volume to 13.2 percent.
Retail dollar value was estimated at $27.6 billion, representing 24.1 percent market share and 7 percent growth over 2017. Growth for small and independent brewers occurred in an overall down beer market, which dropped 1 percent by volume in 2018. The 50 fastest growing breweries delivered 10 percent of craft brewer growth. Craft brewers provided more than 150,000 jobs, an increase of 11 percent over 2017.

“Craft maintained a fairly stable growth rate in 2018 and continued to gain share in the beer market,” said Bart Watson, chief economist, Brewers Association. “Small and independent brewers continue to serve as job creators, strong economic contributors, and community beacons.”
There were 7,346 craft breweries operating in 2018, including 4,521 microbreweries, 2,594 brewpubs, and 231 regional craft breweries. Throughout the year, there were 1,049 new brewery openings and 219 closings — a closing rate of 3 percent.
Suggestion: Attend CBB‘s free webinar — Bottling Your Brand: What Craft Brewers Need to Know about Trademark Protection by clicking right here.
“The beer landscape is facing new realities with category competition, societal shifts and other variables in play. There are still pockets of opportunity both in terms of geography and business model, but brewers need to be vigilant about quality, differentiation, and customer service,” added Watson.
Note: Numbers are preliminary. For additional insights from Bart Watson, visit Insights & Analysis on the Brewers Association website. A more extensive analysis will be released during the Craft Brewers Conference and BrewExpo America in Denver, Colo. from April 8-11. The full 2018 industry analysis will be published in the May/June 2019 issue of The New Brewer, highlighting regional trends and production by individual breweries.
*Absolute figures reflect the dynamic craft brewer data set as specified by the craft brewer definition. Growth numbers are presented on a comparable base. For full methodology, see the Brewers Association website
**Volume by craft brewers represent total taxable production.


Leave a Reply
You must be logged in to post a comment.